I am a big fan of Yeoman and have been working with it quite a bit lately. As with all development at some point you are going to need to set break points and step through the code. Luckily Visual Studio Code is not only a great editor it has fantastic tools for debugging Node.js.
The key is starting node with the –debug-brk switch. For example I have a Yeoman generator that I am developing call yo team. To attach the debugger I first need to add a configuration to Code.
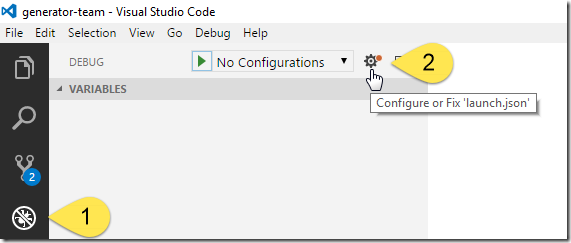
- Click Debug in the Activity Bar
- Then click the gear to add a configuration

- Now click Node.js

- Now either start a command prompt, PowerShell or as I have, configure the integrated terminal to PowerShell and type the following command replacing team with the name of your generator
node --debug-brk .\node_modules\yo\lib\cli.js team

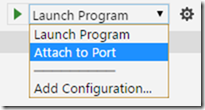
- Now switch the debugger configuration to Attach to Port

- Click the Start Debugging button
Now Code will attach to the process and break at the first line. Now you can set break points and step through the code of your generator.